Refer to the graphs shown. The market is salmon steaks. Which graph best represents the impact of increased concern that salmon is becoming endangered? 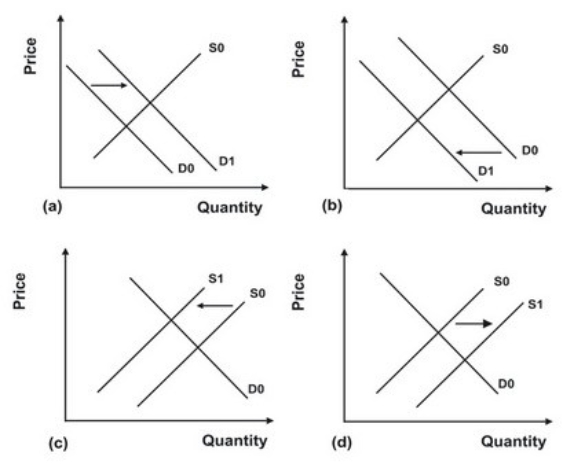
A) Graph a
B) Graph b
C) Graph c
D) Graph d
Correct Answer:
Verified
Q135: When workers are paid higher wages, production
Q136: Refer to the graphs shown. The relevant
Q137: In Operation Desert Storm, oil facilities in
Q138: If market supply increases, equilibrium price will:
A)
Q139: Refer to the graphs shown. Higher costs
Q141: For which of the following markets would
Q142: The statement, "Assuming that if it is
Q143: When airlines were deregulated, airfares declined by
Q144: One reason economists distinguish between micro and
Q145: Refer to the graphs shown. Suppose the
Unlock this Answer For Free Now!
View this answer and more for free by performing one of the following actions

Scan the QR code to install the App and get 2 free unlocks

Unlock quizzes for free by uploading documents