Refer to the graphs shown. Suppose the price of a good that is a substitute in both consumption and production for the good depicted in the graph falls. The expected shifts in supply and demand are shown in: 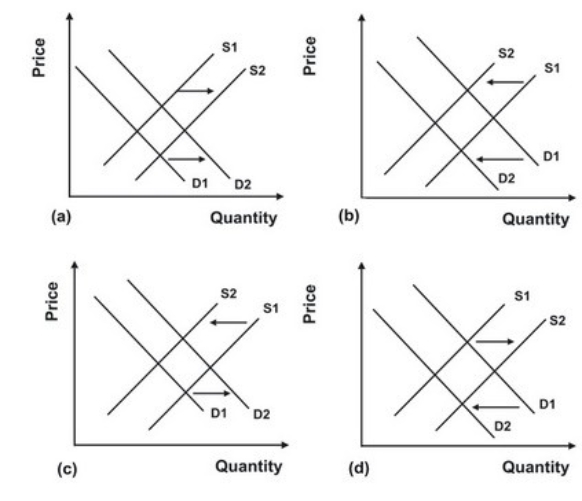
A) a.
B) b.
C) c.
D) d.
Correct Answer:
Verified
Q140: Refer to the graphs shown. The market
Q141: For which of the following markets would
Q142: The statement, "Assuming that if it is
Q143: When airlines were deregulated, airfares declined by
Q144: One reason economists distinguish between micro and
Q146: Refer to the graphs shown. The effect
Q147: How would a decline in demand for
Q148: For which of the following markets would
Q149: The fallacy of composition refers to the
Q150: The false assumption that what is true
Unlock this Answer For Free Now!
View this answer and more for free by performing one of the following actions

Scan the QR code to install the App and get 2 free unlocks

Unlock quizzes for free by uploading documents