Refer to the graph shown. The graph exhibits economies of scale: 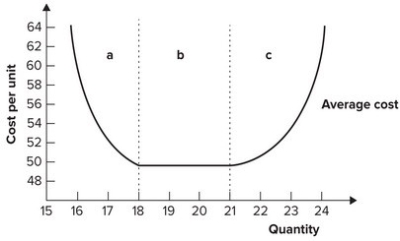
A) in region a.
B) in region b.
C) in region c.
D) over the entire range of output.
Correct Answer:
Verified
Q44: The long-run average cost curve is typically:
A)
Q46: Which of the following provides the best
Q48: Which of the following provides the best
Q49: Which of the following is most likely
Q52: Using 100 workers and 10 machines, a
Q58: At the minimum efficient level of production:
A)
Q60: Diseconomies of scale are associated with:
A) decreasing
Q61: Refer to the graph shown. A firm
Q67: The short-run average total cost curve is
Q70: The upward-sloping portion of the long-run average
Unlock this Answer For Free Now!
View this answer and more for free by performing one of the following actions

Scan the QR code to install the App and get 2 free unlocks

Unlock quizzes for free by uploading documents