Refer to the graph shown. A firm that produces 900 units of output using the plant size associated with SATC2 minimizes: 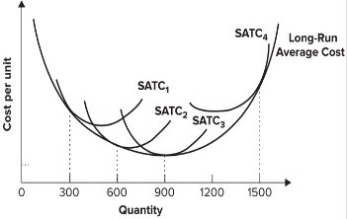
A) both long-run and short-run average total cost.
B) long-run average total cost only.
C) short-run average total cost only.
D) neither long-run nor short-run average total cost.
Correct Answer:
Verified
Q44: The long-run average cost curve is typically:
A)
Q48: Which of the following provides the best
Q49: Which of the following is most likely
Q58: At the minimum efficient level of production:
A)
Q58: Refer to the graph shown. The graph
Q65: The relationship between long-run and short-run average
Q67: The short-run average total cost curve is
Q70: The upward-sloping portion of the long-run average
Q77: A firm's average cost increases as it
Q79: The long-run average cost curve is horizontal
Unlock this Answer For Free Now!
View this answer and more for free by performing one of the following actions

Scan the QR code to install the App and get 2 free unlocks

Unlock quizzes for free by uploading documents