Refer to the graphs shown. The arrow that best captures the impact of a decline in price on quantity supplied is: 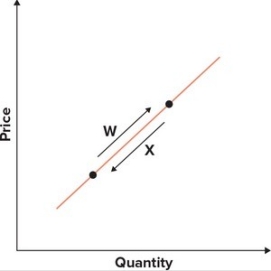
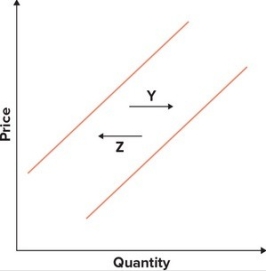
A) W.
B) X.
C) Y.
D) Z.
Correct Answer:
Verified
Q51: The law of supply states that, other
Q58: Refer to the graphs shown. Assume the
Q59: Given the graph, the quantity that would
Q60: Refer to the table that presents
Q61: Assume the graphs shown reflect the egg
Q64: Refer to the graph showing the supply
Q65: Which of the following would be expected
Q67: Moore's Law states that the processing power
Q71: If Argentina imposes a 20 percent tax
Q77: An upward-sloping supply curve implies that:
A) quantity
Unlock this Answer For Free Now!
View this answer and more for free by performing one of the following actions

Scan the QR code to install the App and get 2 free unlocks

Unlock quizzes for free by uploading documents