Moore's Law states that the processing power of the latest computer chips doubles about every eighteen months. Assuming the graphs demonstrate the market for the latest computer chips, which of the following diagrams describe this situation? 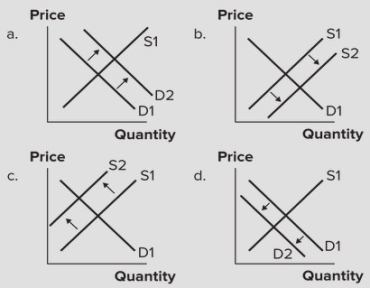
A) Graph a
B) Graph b
C) Graph c
D) Graph d
Correct Answer:
Verified
Q62: Refer to the graphs shown. The arrow
Q63: When applied to labor markets, the law
Q64: Refer to the graph showing the supply
Q65: Which of the following would be expected
Q67: If the price of steel rises, the
Q69: Suppose when you are offered $8.00 per
Q70: Suppose OPEC oil cartel announces that it
Q71: If Argentina imposes a 20 percent tax
Q72: Refer to the graphs shown. If quantity
Q77: An upward-sloping supply curve implies that:
A) quantity
Unlock this Answer For Free Now!
View this answer and more for free by performing one of the following actions

Scan the QR code to install the App and get 2 free unlocks

Unlock quizzes for free by uploading documents