Refer to the graphs shown. The relevant market is corn. The impact of a poor corn harvest on the market for corn would most likely be demonstrated by which graph? 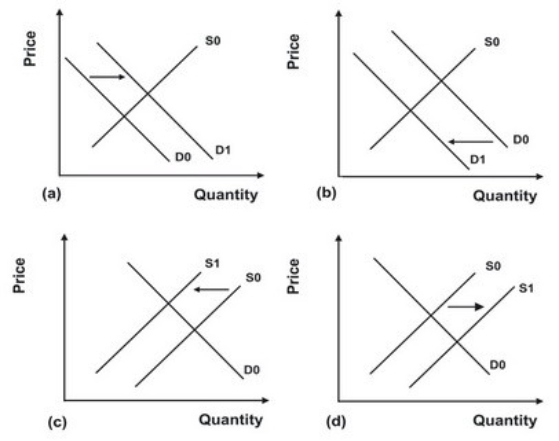
A) Graph a
B) Graph b
C) Graph c
D) Graph d
Correct Answer:
Verified
Q6: What are normal goods? What are inferior
Q122: If both buyers and sellers expect the
Q123: An increase in equilibrium price and a
Q132: Given that diesel cars get much better
Q134: Honey and jam are substitute products. If
Q136: Refer to the graphs shown. The market
Q137: In Operation Desert Storm, oil facilities in
Q147: How would a decline in demand for
Q148: For which of the following markets would
Q150: The false assumption that what is true
Unlock this Answer For Free Now!
View this answer and more for free by performing one of the following actions

Scan the QR code to install the App and get 2 free unlocks

Unlock quizzes for free by uploading documents