Refer to the graphs shown. The market is salmon steaks. Which graph best represents the impact of increased concern that salmon is becoming endangered? 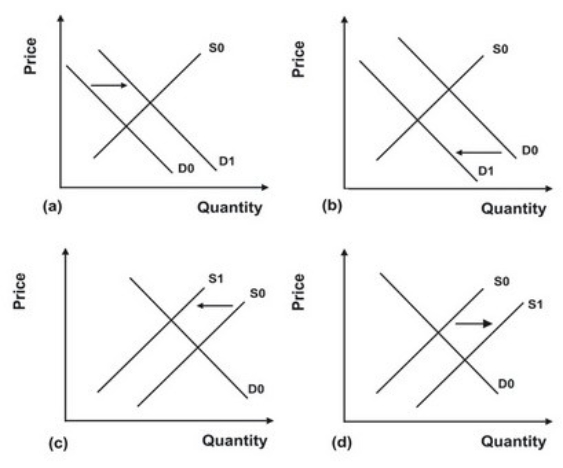
A) Graph a
B) Graph b
C) Graph c
D) Graph d
Correct Answer:
Verified
Q6: What are normal goods? What are inferior
Q121: The price of a ticket to the
Q122: If both buyers and sellers expect the
Q123: An increase in equilibrium price and a
Q127: When the drug Vioxx was pulled from
Q132: Refer to the graphs shown. The market
Q132: Given that diesel cars get much better
Q134: Honey and jam are substitute products. If
Q137: In Operation Desert Storm, oil facilities in
Q139: Refer to the graphs shown. The relevant
Unlock this Answer For Free Now!
View this answer and more for free by performing one of the following actions

Scan the QR code to install the App and get 2 free unlocks

Unlock quizzes for free by uploading documents