Refer to the graphs shown. The market is fat-free potato chips that contain the fat substitute olestra. Which graph best represents the impact of increased consumer concern about the effects of olestra on long-term health? 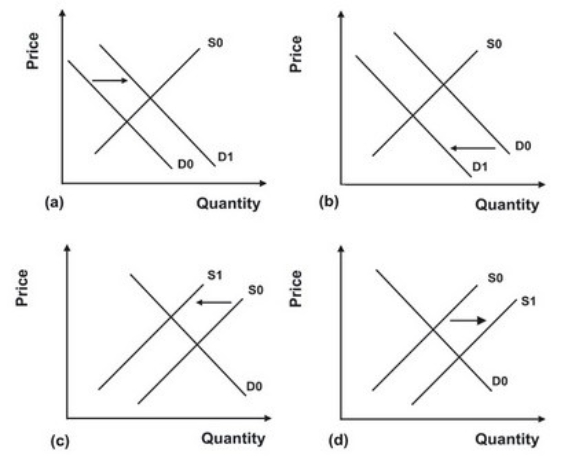
A) Graph a
B) Graph b
C) Graph c
D) Graph d
Correct Answer:
Verified
Q103: The point at which the supply curve
Q109: Demand for healthy kidneys is high in
Q113: The increase in the availability of organic
Q115: Using the supply and demand model, what
Q118: If you observe a market where quantity
Q124: Refer to the graphs shown. Higher costs
Q124: The model of supply and demand leads
Q125: Refer to the graphs shown. The market
Q126: A decrease in the number of consumers
Q135: When workers are paid higher wages, production
Unlock this Answer For Free Now!
View this answer and more for free by performing one of the following actions

Scan the QR code to install the App and get 2 free unlocks

Unlock quizzes for free by uploading documents