Refer to the graphs shown. The market is caviar. Which graph best represents the impact of an increase in consumer incomes on the market for caviar? 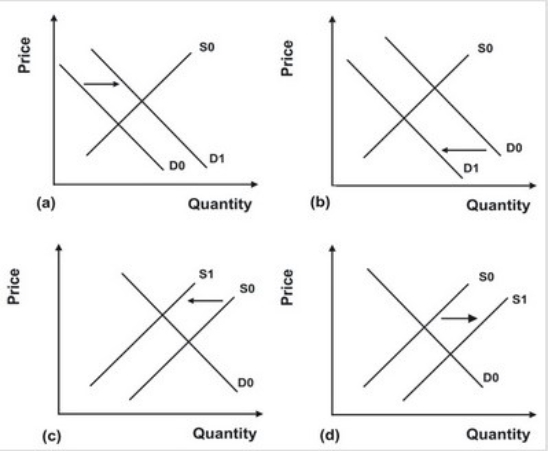
A) Graph a
B) Graph b
C) Graph c
D) Graph d
Correct Answer:
Verified
Q113: The increase in the availability of organic
Q121: Refer to the graphs shown. The market
Q124: Refer to the graphs shown. Higher costs
Q124: The model of supply and demand leads
Q125: If supply and demand both shift to
Q126: A decrease in the number of consumers
Q127: Refer to the graphs shown. The consequences
Q131: The model of supply and demand leads
Q135: When workers are paid higher wages, production
Q138: If market supply increases, equilibrium price will:
A)
Unlock this Answer For Free Now!
View this answer and more for free by performing one of the following actions

Scan the QR code to install the App and get 2 free unlocks

Unlock quizzes for free by uploading documents