Refer to the graph below. 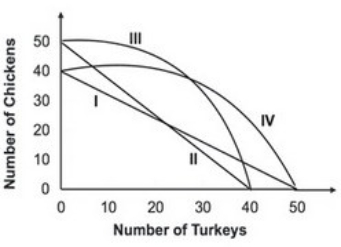 Suppose that the opportunity cost of producing 10 chickens is always 8 turkeys. Given this, the relevant production possibility curve must be:
A) I.
B) II.
C) III.
D) IV.
Correct Answer:
Verified
Q1: Two nations with differing comparative advantages will
Q9: Two nations with differing comparative advantages will
Q11: If a country has a comparative advantage
Q13: The production possibility table below is
Q14: Refer to the production possibility curve for
Q18: Suppose each of the following rows
Q20: Because you can get more of one
Q20: Consider the table below, in which
Q30: If there were decreasing marginal opportunity costs,
Q32: Increasing marginal opportunity cost means that the
Unlock this Answer For Free Now!
View this answer and more for free by performing one of the following actions

Scan the QR code to install the App and get 2 free unlocks

Unlock quizzes for free by uploading documents