The production possibility table below is for growing broccoli and asparagus in a 320-square-foot garden in one season. 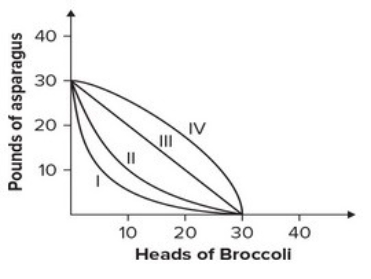 Which curve on the graph on the right corresponds to this table?
A) I
B) II
C) III
D) IV
Correct Answer:
Verified
Q8: The law of one price means that
Q9: Refer to the graph below. 
Q9: Two nations with differing comparative advantages will
Q11: If a country has a comparative advantage
Q11: Evan can grow both roses and
Q13: An economy that operates inside its production
Q14: Refer to the production possibility curve for
Q17: Refer to the graph below.
Q18: Suppose each of the following rows
Q20: Because you can get more of one
Unlock this Answer For Free Now!
View this answer and more for free by performing one of the following actions

Scan the QR code to install the App and get 2 free unlocks

Unlock quizzes for free by uploading documents