(Figure: Graph Examples) Which graph in the figure is an example of a bar chart? 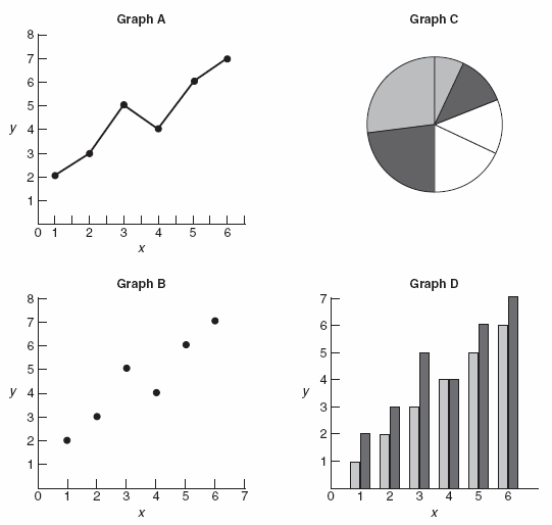
A) graph A
B) graph B
C) graph C
D) graph D
Correct Answer:
Verified
Q167: (Figure: Crop Yield and Fertilizer) The graph
Q168: If temperature and ice cream sales are
Q173: (Table) Using the information in the
Q174: If a graph between hot chocolate sales
Q174: (Figure: Graph Examples) Which graph is an
Q175: (Figure: Education and Earnings) The hypothetical graph
Q176: (Figure: Mileage and Speed by Car Weight)
Q200: A graph of a business cycle that
Q220: If a graph showed that as the
Q248: Pie charts
A) depict two variables to see
Unlock this Answer For Free Now!
View this answer and more for free by performing one of the following actions

Scan the QR code to install the App and get 2 free unlocks

Unlock quizzes for free by uploading documents