(Figure: Crop Yield and Fertilizer) The graph shows a hypothetical relationship between tons of fertilizer used and crop yields. Which statement is NOT correct? 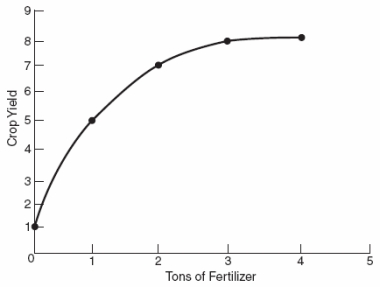
A) The slope of the curve between one and two tons of fertilizer is approximately 2.
B) The relationship between fertilizer usage and yield is nonlinear.
C) Because the relationship is nonlinear, it is difficult to create an economic model describing the relationship between the two variables.
D) Using more than three tons of fertilizer has minimal effect on yield.
Correct Answer:
Verified
Q162: (Figure: Weight Loss and Exercise Time) According
Q163: (Figure: Mileage and Speed by Car Weight)
Q164: (Table) If the numbers in the
Q165: (Figure: Graph Examples) Which graph is an
Q166: (Table) If the numbers in the
Q168: If temperature and ice cream sales are
Q172: (Figure: Graph Examples) Which graph in the
Q174: If a graph between hot chocolate sales
Q200: A graph of a business cycle that
Q248: Pie charts
A) depict two variables to see
Unlock this Answer For Free Now!
View this answer and more for free by performing one of the following actions

Scan the QR code to install the App and get 2 free unlocks

Unlock quizzes for free by uploading documents