(Figure: Weight Loss and Exercise Time) According to the data in the graph, where weight loss is shown on the y axis, every 2 extra hours of exercise: 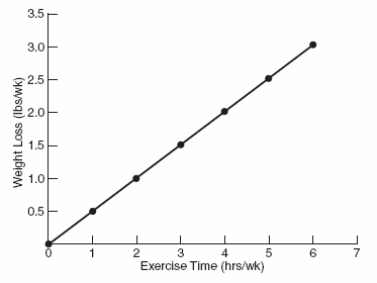
A) increases weight by 1 pound.
B) decreases weight by 1/2 pound.
C) decreases weight by 1 pound.
D) increases weight by 1/2 pound.
Correct Answer:
Verified
Q4: Which statement is NOT considered a key
Q134: Information plays an important role in the
Q158: Which statement describes a time in the
Q163: (Figure: Mileage and Speed by Car Weight)
Q164: (Table) If the numbers in the
Q165: (Figure: Graph Examples) Which graph is an
Q166: (Table) If the numbers in the
Q167: (Figure: Crop Yield and Fertilizer) The graph
Q230: Economists generally do NOT define an institution
Q279: If you plot temperature on the y
Unlock this Answer For Free Now!
View this answer and more for free by performing one of the following actions

Scan the QR code to install the App and get 2 free unlocks

Unlock quizzes for free by uploading documents