The graph presented below represents the post-test FER data, but what is its correct title? 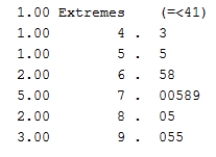
A) Stem-and-leaf plot
B) Histogram
C) Line plot
D) Error bar plot
Correct Answer:
Verified
Q3: Normally distributed data are normally referred to
Q5: Which measure of central tendency is presented
Q8: Twenty-five percentile points is commonly referred to
Q14: Which measure of data distribution is presented
Q14: Plot the FEV1 data presented in Q11
Q15: Which of the following is a type
Q16: Which of the following are important components
Q18: A researcher randomized 75 children into three
Q20: Inspect the post-test box-whisker plot. Which of
Q20: A histogram is most closely related to
Unlock this Answer For Free Now!
View this answer and more for free by performing one of the following actions

Scan the QR code to install the App and get 2 free unlocks

Unlock quizzes for free by uploading documents