Examine the figure below.Assume each sugar molecule represents a percentage point of sugar dissolved in the solution.Over time,the solution level on the left side of the figure would ________,while the solution level on the right side of the figure would ________.This is because the solution on the left side of the figure is ________,while the solution on the right side of the figure is ________. 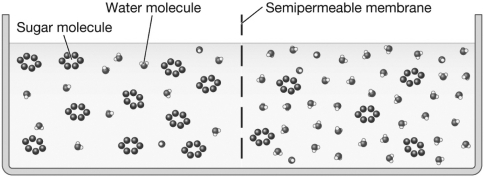
A) rise; decrease; hypertonic; hypotonic
B) decrease; rise; hypertonic; hypotonic
C) decrease; rise; hypotonic; hypertonic
D) There will be no net movement of water because the solutions are isotonic.
Correct Answer:
Verified
Q1: If the concentration of sugar molecules in
Q3: Cheryl is in a lab attempting to
Q9: Some antibiotics used to treat bacterial infections
Q10: Dialysis tubing is a selectively permeable membrane
Q12: Scientists repeat their experiments over and over
Q14: The selective permeability of a phospholipid bilayer
Q16: A screen door allows breezes to enter
Q17: Adenine (A),thymine (T),guanine (G),and cytosine (C)are the
Q19: During the process of _,water diffuses across
Q20: Cells naturally,without using energy,respond to changes in
Unlock this Answer For Free Now!
View this answer and more for free by performing one of the following actions

Scan the QR code to install the App and get 2 free unlocks

Unlock quizzes for free by uploading documents