Which of the following graphs represents the magnitude of the electric field as a function of the distance from the center of a solid charged conducting sphere of radius R? 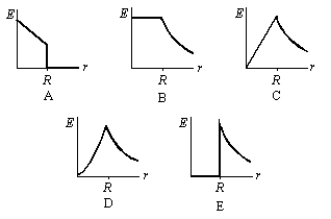
A) A
B) B
C) C
D) D
E) E
Correct Answer:
Verified
Q22: A particle with charge +Q is placed
Q25: The outer surface of the cardboard center
Q30: Charge is distributed uniformly along a long
Q31: Two large insulating parallel plates carry charge
Q32: A conducting sphere of radius 0.01 m
Q34: Two large insulating parallel plates carry positive
Q34: 10 C of charge are placed on
Q35: A 300-N/C uniform electric field points perpendicularly
Q36: A conducting sphere of radius 5.0 cm
Q39: Two large conducting parallel plates carry charge
Unlock this Answer For Free Now!
View this answer and more for free by performing one of the following actions

Scan the QR code to install the App and get 2 free unlocks

Unlock quizzes for free by uploading documents