Use the figure below to answer the following questions.
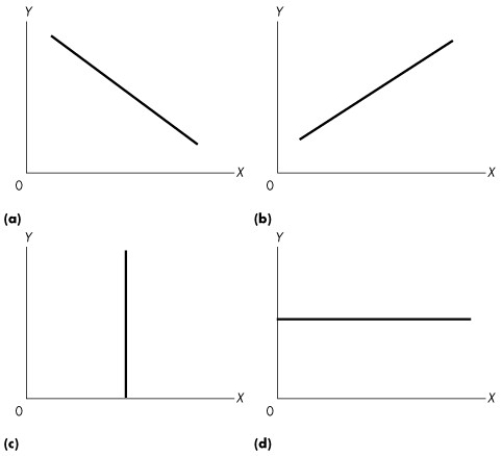
Figure 1A.2.3
-Refer to Figure 1A.2.3.If you were told that economic theory predicts that higher levels of the rate of interest (x) lead to lower levels of sales of houses (y) ,which graph would you pick to represent this economic relationship?
A) (a) or (d)
B) (d)
C) (b)
D) (c)
E) (a)
Correct Answer:
Verified
Q122: Use the table below to answer the
Q122: Use the figure below to answer the
Q126: Use the figure below to answer the
Q130: The change in the value of the
Q138: Use the figure below to answer the
Q141: Use the table below to answer the
Q147: Use the figure below to answer the
Q148: The slope of a straight line
A)is the
Q151: Use the table below to answer the
Q154: Use the figure below to answer the
Unlock this Answer For Free Now!
View this answer and more for free by performing one of the following actions

Scan the QR code to install the App and get 2 free unlocks

Unlock quizzes for free by uploading documents