Use the figure below to answer the following question.
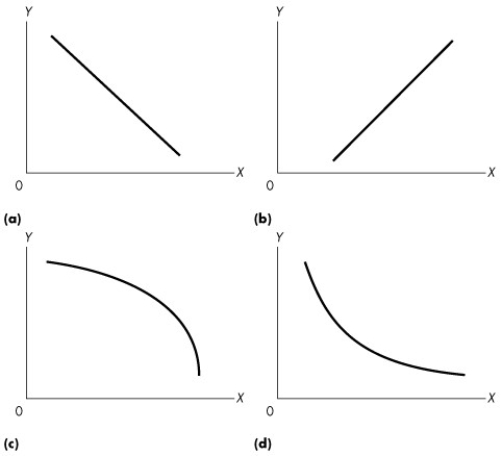
Figure 1A.2.6
-Refer to Figure 1A.2.6.Consider the values for x and y given in the following table: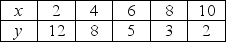
Which one of the graphs in Figure A1.13 represents the relationship between x and y?
A) (a)
B) (b)
C) (c)
D) (d)
E) (a) and (b)
Correct Answer:
Verified
Q122: Use the figure below to answer the
Q122: Use the table below to answer the
Q126: Use the figure below to answer the
Q134: Use the figure below to answer the
Q147: Use the figure below to answer the
Q151: Use the table below to answer the
Q157: Use the figure below to answer the
Q159: The slope of a horizontal line is
A)positive.
B)negative.
C)zero.
D)infinite.
E)initially
Q162: Use the table below to answer the
Q163: At all points along a straight line,slope
Unlock this Answer For Free Now!
View this answer and more for free by performing one of the following actions

Scan the QR code to install the App and get 2 free unlocks

Unlock quizzes for free by uploading documents