Use the figure below to answer the following question.
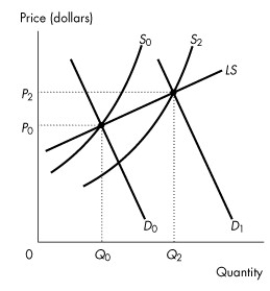
Figure 12.5.1
-Refer to Figure 12.5.1.Given the increase in market demand from D? to D?,the graph represents
A) a constant cost industry.
B) an increasing cost industry.
C) a decreasing cost industry.
D) an inefficient market.
E) a market experiencing a technological change.
Correct Answer:
Verified
Q63: Use the figure below to answer the
Q66: In which one of the following situations
Q75: If a profit-maximizing firm in a perfectly
Q81: Firms will stop exiting an market only
Q84: Long-run equilibrium occurs in a competitive market
Q86: The long-run market supply curve is positively
Q87: Consider a perfectly competitive market with long-run
Q90: Use the table below to answer the
Q95: Suppose that the market in which bakeries
Q97: Use the figure below to answer the
Unlock this Answer For Free Now!
View this answer and more for free by performing one of the following actions

Scan the QR code to install the App and get 2 free unlocks

Unlock quizzes for free by uploading documents