The figure below shows a graph of the scale factor, RU, with time, for three different scenarios.The age of the universe is the difference between now and the time at which RU is zero.Which curve illustrates a universe that is expanding at a constant rate? 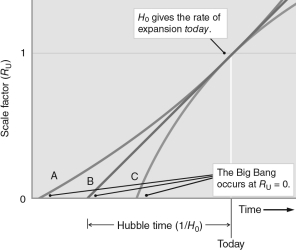
A) A
B) B
C) C
D) All of these curves are valid for constantly-expanding universe.
E) None of these curves is valid for constantly-expanding universe.
Correct Answer:
Verified
Q32: The figure below shows five possible
Q33: Select the true statement:
A) (
Q34: Which of the curves in the figure
Q35: The universe can be infinite in size
Q36: Choose the correct statement about inflation.
A) It
Q38: The figure below shows a graph of
Q39: Quantum chromodynamics (QCD) describes how _ works.
A)
Q40: The figure below shows five graphs
Q41: Which fundamental force is responsible for radioactive
Q42: What would the universe be like if
Unlock this Answer For Free Now!
View this answer and more for free by performing one of the following actions

Scan the QR code to install the App and get 2 free unlocks

Unlock quizzes for free by uploading documents