The figure below shows five possible graphs of the scale factor of the universe as a function of time.Which of these graphs represent our universe, where m = 0.3 and =0.7? 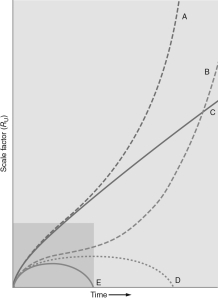
A) A
B) B
C) C
D) D
E) E
Correct Answer:
Verified
Q27: The figure below shows five graphs
Q28: In a scenario in which dark energy
Q29: Why is the smoothness of the cosmic
Q30: Why would it be very improbable
Q31: Which of the curves in the figure
Q33: Select the true statement:
A) (
Q34: Which of the curves in the figure
Q35: The universe can be infinite in size
Q36: Choose the correct statement about inflation.
A) It
Q37: The figure below shows a graph of
Unlock this Answer For Free Now!
View this answer and more for free by performing one of the following actions

Scan the QR code to install the App and get 2 free unlocks

Unlock quizzes for free by uploading documents