A graph of the force on an object as a function of its position is shown in the figure. Determine the amount of work done by this force on an object that moves from x = 1.0 m to x = 6.0 m. (Assume an accuracy of 2 significant figures for the numbers on the graph.) 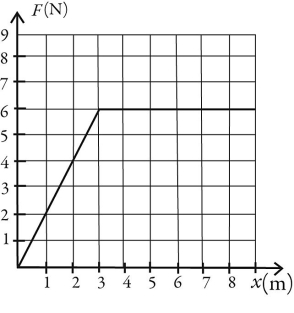
A) 26 J
B) 29 J
C) 22 J
D) 35 J
E) 27 J
Correct Answer:
Verified
Q4: An airplane flies 120 km at a
Q31: A force Q32: In the figure, a 700-kg crate is Q33: An object attached to an ideal massless Q34: A crane lifts a 425 kg steel Q35: Three forces, F1 = 20.0 N, F2 Q37: A force on a particle depends on Q38: A graph of the force on an Q38: A ball is thrown upward at an Q39: For the vectors shown in the figure,![]()
Unlock this Answer For Free Now!
View this answer and more for free by performing one of the following actions

Scan the QR code to install the App and get 2 free unlocks

Unlock quizzes for free by uploading documents