A graph of the force on an object as a function of its position is shown in the figure. Determine the amount of work done by this force on the object during a displacement from x = -2.00 m to x = 2.00 m. (Assume an accuracy of 3 significant figures for the numbers
On the graph.) 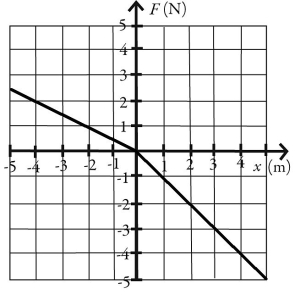
A) -12.0 J
B) -3.00 J
C) -1.00 J
D) 12.0 J
E) 3.00 J
Correct Answer:
Verified
Q4: An airplane flies 120 km at a
Q33: An object attached to an ideal massless
Q34: A crane lifts a 425 kg steel
Q35: Three forces, F1 = 20.0 N, F2
Q36: A graph of the force on an
Q37: A force on a particle depends on
Q38: A ball is thrown upward at an
Q39: For the vectors shown in the figure,
Q41: A 7.0-kg rock is subject to a
Q43: In the figure, two boxes, each of
Unlock this Answer For Free Now!
View this answer and more for free by performing one of the following actions

Scan the QR code to install the App and get 2 free unlocks

Unlock quizzes for free by uploading documents