The graph in the figure shows the x component of the acceleration of a 2.4-kg object as a function of time (in ms). 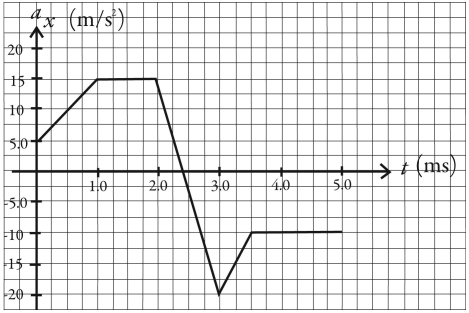 (a) At what time(s) does the x component of the net force on the object reach its maximum magnitude, and what is that maximum magnitude?
(b) What is the x component of the net force on the object at time t = 0.0 ms and at t = 4.0 ms?
Correct Answer:
Verified
View Answer
Unlock this answer now
Get Access to more Verified Answers free of charge
Q3: An object is moving to the right,and
Q6: Suppose the force of the air drag
Q18: The figure shows an acceleration-versus-force graph for
Q18: A woman is straining to lift a
Q20: A crate is sliding down an inclined
Q22: The figure shows two forces acting on
Q23: The figure shows two forces acting at
Q24: The graph in the figure shows the
Q25: The figure shows a graph of the
Q26: The figure shows a graph of the
Unlock this Answer For Free Now!
View this answer and more for free by performing one of the following actions

Scan the QR code to install the App and get 2 free unlocks

Unlock quizzes for free by uploading documents