The graph in the figure shows the net force acting on a 3.0-kg object as a function of time. 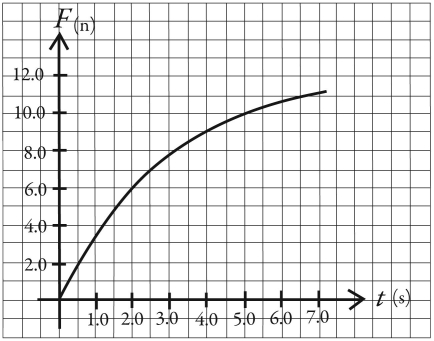 (a) What is the acceleration of this object at time t = 2.0 s?
(b) Draw, to scale, a graph of the acceleration of this object as a function of time over the range t = 0.00 s to t = 7.0 s.
Correct Answer:
Verified
(b) The accelerati...
View Answer
Unlock this answer now
Get Access to more Verified Answers free of charge
Q6: Suppose the force of the air drag
Q20: A crate is sliding down an inclined
Q21: The graph in the figure shows the
Q21: On its own,a certain tow-truck has a
Q22: The figure shows two forces acting on
Q23: The figure shows two forces acting at
Q25: The figure shows a graph of the
Q26: The figure shows a graph of the
Q27: The figure shows two forces, each of
Q28: Two forces act on a 
Unlock this Answer For Free Now!
View this answer and more for free by performing one of the following actions

Scan the QR code to install the App and get 2 free unlocks

Unlock quizzes for free by uploading documents