Figure 21-1 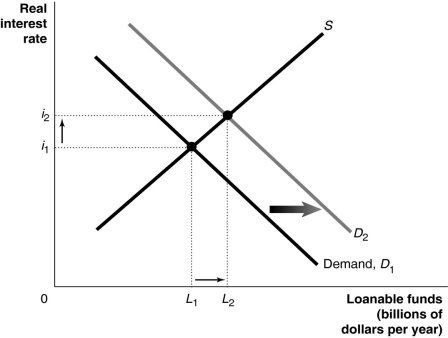
-Refer to Figure 21-1. Which of the following is consistent with the graph depicted above?
A) An expected recession decreases the profitability of new investment.
B) Technological change increases the profitability of new investment.
C) The government runs a budget surplus.
D) Households become spendthrifts and begin to save less.
Correct Answer:
Verified
Q103: If consumers decide to be more frugal
Q104: If net taxes fall by $80 billion,we
Q105: A government budget surplus from reduced government
Q106: In comparison to a government that runs
Q107: If Ebenezer Scrooge spends rather than saves
Q109: Figure 21-3 Q115: Figure 21-5 Q115: How will an increase in the government Q116: Which of the following would you expect Q117: Figure 21-4 Unlock this Answer For Free Now! View this answer and more for free by performing one of the following actions Scan the QR code to install the App and get 2 free unlocks Unlock quizzes for free by uploading documents![]()
![]()
![]()

