Figure 21-4 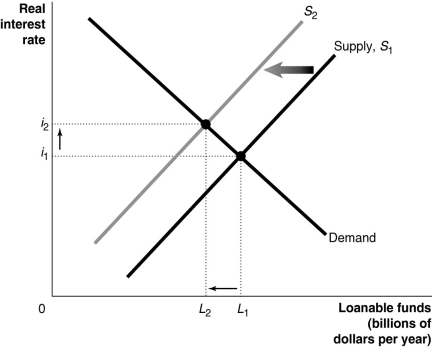
-Refer to Figure 21-4. Which of the following is consistent with the graph depicted?
A) an increase in household income
B) an increase in transfer payments to households
C) an increase in the proportion of income after net taxes used for consumption
D) an increase in tax revenues collected by the government
Correct Answer:
Verified
Q104: If net taxes fall by $80 billion,we
Q106: In comparison to a government that runs
Q108: The Congressional Budget Office reported that federal
Q113: Figure 21-1 Q114: The response of investment spending to an![]()
Unlock this Answer For Free Now!
View this answer and more for free by performing one of the following actions

Scan the QR code to install the App and get 2 free unlocks

Unlock quizzes for free by uploading documents