Multiple Choice
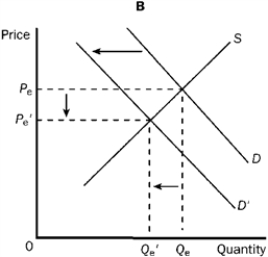
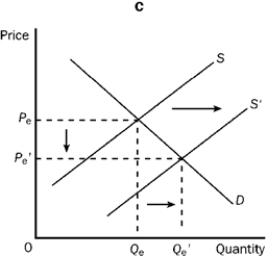
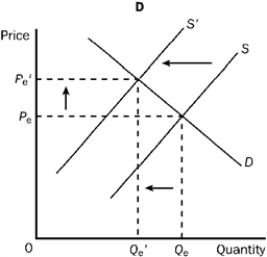
Figure 3-22 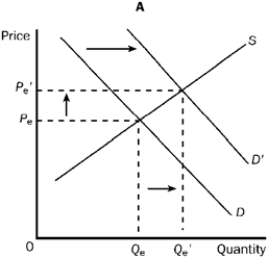
-Refer to Figure 3-22. Graph A shows which of the following?
A) An increase in demand and an increase in quantity supplied.
B) An increase in demand and an increase in supply.
C) An increase in quantity demanded and an increase in quantity supplied.
D) An increase in supply and an increase in quantity demanded.
Correct Answer:
Verified
Related Questions

