Multiple Choice
Figure 3-22 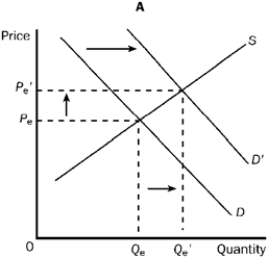
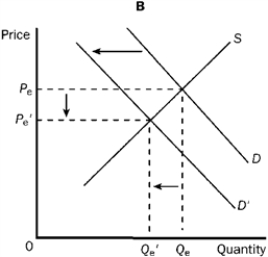
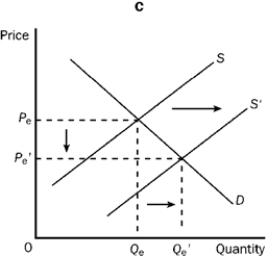
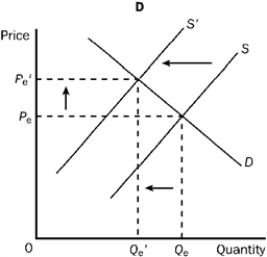
-Refer to Figure 3-22. Which of the four graphs illustrates a decrease in quantity demanded?
A) A
B) B
C) C
D) D
Correct Answer:
Verified
Related Questions
Q120: Q121: Figure 3-23 Q122: Figure 3-22 Q123: Figure 3-22 Q124: Figure 3-23 Q126: Figure 3-20 Q127: Figure 3-20 Q128: Suppose a person defects from Cuba (a Q129: Figure 3-22 Q130: Figure 3-22 Unlock this Answer For Free Now! View this answer and more for free by performing one of the following actions Scan the QR code to install the App and get 2 free unlocks Unlock quizzes for free by uploading documents![]()
![]()
![]()
![]()
![]()
![]()
![]()
![]()
![]()

