 Figure 13-4B
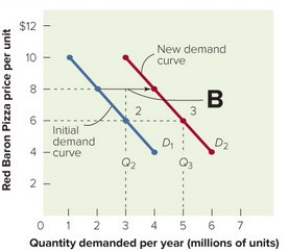
-In Figure 13-4B above, the demand curve shifts from D2to D3(B) . This most likely represents
A) an increase in demand resulting from competitor or consumer changes.
B) an increase in demand that required a decrease in price.
C) no change in price and no change in demand.
D) no change in demand or price but a greater profit due to economies of scale.
E) a decrease in price from $8 to $6 per unit.
Correct Answer:
Verified
Q152: Demand for a product is likely to
Q153: Which of these illustrates movement along the
Q154: Mrs. Renfro's, Inc., sells 25 different relishes
Q155: In a snack vending machine, consumers can
Q156: Which of these best illustrates a shift
Q158: The percentage change in quantity demanded relative
Unlock this Answer For Free Now!
View this answer and more for free by performing one of the following actions

Scan the QR code to install the App and get 2 free unlocks

Unlock quizzes for free by uploading documents