This figure depicts population growth for three different populations. 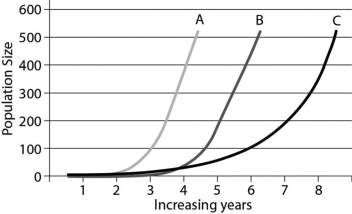
-If all 3 populations occupy different areas that are approximately the same size, which population has the lowest density in year 5?
A) Population A
B) Population B
C) Population C
D) All three populations will have the same density.
Correct Answer:
Verified
Q42: Suppose a density-dependent factor acted on the
Q43: Scenario
Michigan's Isle Royale is an island located
Q44: Scenario
In May 2014, the European Union (EU)published
Q45: Q46: Which possible description best matches this figure? Q47: Scenario Q48: Scenario Q49: Scenario Q50: This figure depicts population growth for three Q51: This figure depicts population growth for three![]()
In May 2014, the European Union (EU)published
Michigan's Isle Royale is an island located
Michigan's Isle Royale is an island located
Unlock this Answer For Free Now!
View this answer and more for free by performing one of the following actions

Scan the QR code to install the App and get 2 free unlocks

Unlock quizzes for free by uploading documents