The figure shows a graph of the position x as a function of time t for a system undergoing simple harmonic motion. Which one of the following graphs represents the acceleration of this system as a function of time? 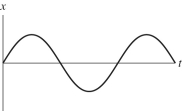
A.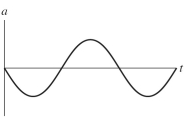
B.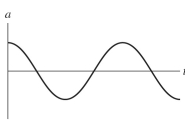
C.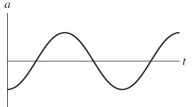
D.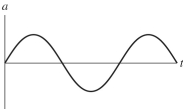
A) graph a
B) graph b
C) graph c
D) graph d
Correct Answer:
Verified
Q1: If we double the frequency of a
Q3: Two simple pendulums, A and B,
Q4: An object is attached to a vertical
Q5: A mass on a spring undergoes SHM.When
Q6: An object is attached to a vertical
Q9: A ball swinging at the end of
Q11: A mass on a spring undergoes SHM.When
Q12: An object is attached to a vertical
Q18: In simple harmonic motion,when is the speed
Q20: Grandfather clocks are designed so they can
Unlock this Answer For Free Now!
View this answer and more for free by performing one of the following actions

Scan the QR code to install the App and get 2 free unlocks

Unlock quizzes for free by uploading documents