The graph in the figure represents the velocity of a particle as it travels along the x-axis. What is the average acceleration of the particle between t = 2.0 s and t = 4.0 s? 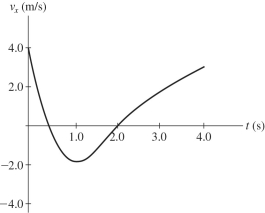
Correct Answer:
Verified
Q107: An object is thrown upwards with a
Q122: Assuming equal rates of acceleration in both
Q123: Two athletes jump straight up.John has twice
Q125: Abby throws a ball straight up and
Q132: To determine the height of a flagpole,Abby
Q134: Abby throws a ball straight up and
Q136: An object is thrown upwards with a
Q145: In the absence of air resistance,
Q150: A car is able to stop
Q152: The graph in the figure shows the
Unlock this Answer For Free Now!
View this answer and more for free by performing one of the following actions

Scan the QR code to install the App and get 2 free unlocks

Unlock quizzes for free by uploading documents