The graph in the figure shows the position of a particle as a function of time as it travels along the x-axis.
(a)What is the average speed of the particle between t = 2.0 s and t = 4.0 s?
(b)What is the average velocity of the particle between t = 2.0 s and t = 4.0 s? 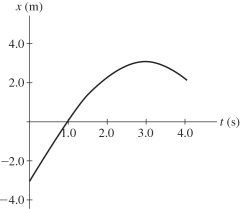
Correct Answer:
Verified
Q102: An astronaut stands by the rim of
Q104: To determine the height of a bridge
Q106: An astronaut stands by the rim of
Q107: An object is thrown upwards with a
Q132: To determine the height of a flagpole,Abby
Q134: Abby throws a ball straight up and
Q147: The graph in the figure represents the
Q150: A car is able to stop
Q155: A car moving initially with speed
Q157: The graph in the figure shows the
Unlock this Answer For Free Now!
View this answer and more for free by performing one of the following actions

Scan the QR code to install the App and get 2 free unlocks

Unlock quizzes for free by uploading documents