The graph in the figure shows the position of a particle as a function of time as it travels along the x-axis.
(a)What is the magnitude of the average velocity of the particle between t = 1.0 s and t = 4.0 s?
(b)What is the average speed of the particle between t = 1.0 s and t = 4.0 s? 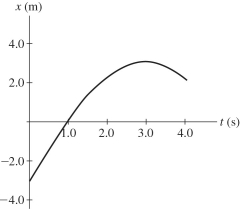
Correct Answer:
Verified
View Answer
Unlock this answer now
Get Access to more Verified Answers free of charge
Q102: An astronaut stands by the rim of
Q104: To determine the height of a bridge
Q106: An astronaut stands by the rim of
Q127: Car A is traveling at twice the
Q133: Two cars are traveling at the same
Q152: The graph in the figure shows the
Q155: A car moving initially with speed
Q159: Two identical objects A and B
Q161: The figure shows the velocity-versus-time graph for
Q162: The graph in the figure shows the
Unlock this Answer For Free Now!
View this answer and more for free by performing one of the following actions

Scan the QR code to install the App and get 2 free unlocks

Unlock quizzes for free by uploading documents