The graph in the figure shows the position of a particle as it travels along the x-axis. What is the magnitude of the average velocity of the particle between t = 1.0 s and t = 4.0 s? 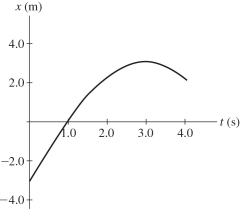
A) 0.25 m/s
B) 0.50 m/s
C) 0.67 m/s
D) 1.0 m/s
E) 1.3 m/s
Correct Answer:
Verified
Q162: The graph in the figure shows the
Q163: The figure shows a graph of the
Q164: The figure shows a graph of the
Q165: The figure shows a graph of the
Q166: The graph in the figure shows the
Q168: The graph in the figure shows the
Q169: The figure shows a graph of the
Q170: The figure shows a graph of the
Q171: The figure shows a graph of the
Q172: The graph in the figure shows the
Unlock this Answer For Free Now!
View this answer and more for free by performing one of the following actions

Scan the QR code to install the App and get 2 free unlocks

Unlock quizzes for free by uploading documents