The figure shows a graph of the position of a moving object as a function of time. What is the velocity of the object at each of the following times?
(a)At t = 1.0 s
(b)At t = 2.5 s
(c)At t = 4.0 s
(d)At t = 5.5 s 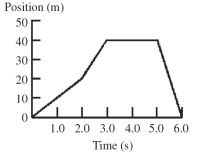
Correct Answer:
Verified
View Answer
Unlock this answer now
Get Access to more Verified Answers free of charge
Q127: Car A is traveling at twice the
Q133: Two cars are traveling at the same
Q159: Two identical objects A and B
Q161: The figure shows the velocity-versus-time graph for
Q162: The graph in the figure shows the
Q164: The figure shows a graph of the
Q165: The figure shows a graph of the
Q166: The graph in the figure shows the
Q167: The graph in the figure shows the
Q168: The graph in the figure shows the
Unlock this Answer For Free Now!
View this answer and more for free by performing one of the following actions

Scan the QR code to install the App and get 2 free unlocks

Unlock quizzes for free by uploading documents