Multiple Choice
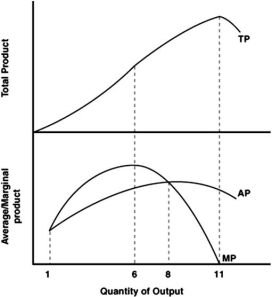
-Refer to the graph above to answer this question.What is the most productive output?
A) 1.
B) 6.
C) 8.
D) 11.
Correct Answer:
Verified
Related Questions
Q48: The graph below illustrates the average and
Q49: The data in the table is for
Q50: Q51: The data in the table is for Q52: The data in the table is for Q54: The graph below illustrates the average and Q55: What is average variable cost? Q56: The graph below illustrates the average and Q57: The data in the table is for Q58: ![]()
A)Total fixed cost![]()
Unlock this Answer For Free Now!
View this answer and more for free by performing one of the following actions

Scan the QR code to install the App and get 2 free unlocks

Unlock quizzes for free by uploading documents