Below is a graphical illustration of a typical firm operating in a monopolistically competitive industry:
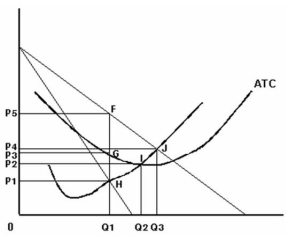
-Refer to the graph above to answer this question.What area graphically represents a profit-maximizing firm's total cost?
A) 0P5FQ1.
B) 0P4JQ1.
C) 0P3GQ1.
D) 0P2IQ2.
E) 0P1HQ1.
Correct Answer:
Verified
Q5: All of the following,except one,could be used
Q6: All of the following,except one,are aspects of
Q7: What is the term for a market
Q8: What is imperfect competition?
A)A market structure in
Q9: Below is a graphical illustration of a
Q11: Which term best describes the attempt by
Q12: Below is a profit pay-off matrix for
Q13: All of the following,except one,are examples of
Q14: Below is a graphical illustration of a
Q15: What is a concentration ratio?
A)A ratio that
Unlock this Answer For Free Now!
View this answer and more for free by performing one of the following actions

Scan the QR code to install the App and get 2 free unlocks

Unlock quizzes for free by uploading documents