The following graph shows the costs and revenues of a typical firm operating in a monopolistically competitive industry.
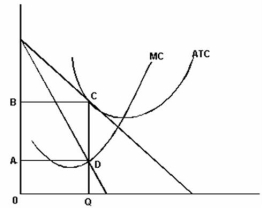
-Refer to the graph above to answer this question.Which of the following will be the result of the situation illustrated in the graph?
A) New firms will enter the industry and this will shift the market supply curve to the right.
B) New firms will enter the industry and this will shift the market supply curve to the left.
C) Some firms will exit from the industry and this will shift the market supply curve to the right.
D) Some firms will exit from the industry and this will shift the market supply curve to the left.
E) Long run equilibrium has been achieved and no new entry or exit of firms will occur.
Correct Answer:
Verified
Q17: Below is a profit pay-off matrix for
Q18: What measures the percentage of an industry's
Q19: Below is a graphical illustration of a
Q20: Below is a profit pay-off matrix for
Q21: The following graph shows the costs and
Unlock this Answer For Free Now!
View this answer and more for free by performing one of the following actions

Scan the QR code to install the App and get 2 free unlocks

Unlock quizzes for free by uploading documents