The dotted line in the following graph shows levels of glucose in a culture of wild-type E. coli grown in Moderate that initially contains both glucose and lactose. The solid line shows levels of transcription of the lac operon. Describe what is happening to the culture and the lac operon, referring to the lac repressor, allolactose, cAMP, and CAP (catabolite activator protein). 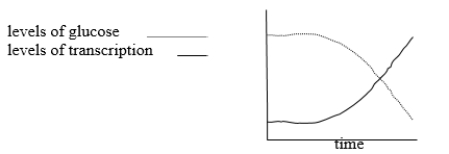
Correct Answer:
Verified
Q44: Fill in the blanks in the following
Q45: Fill in the blanks in this
Q46: You have isolated two mutations linked
Q47: The trp operon is known to operate
Q48: Transcriptional control that acts by regulating the
Q50: Fill in the blanks in the
Q51: An E. coli strain of chromosomal genotype
Q52: The formation of 1+2 and 3+4 secondary
Q53: In the experiments described in the text,
Q54: If a mutation prevents the formation of
Unlock this Answer For Free Now!
View this answer and more for free by performing one of the following actions

Scan the QR code to install the App and get 2 free unlocks

Unlock quizzes for free by uploading documents