Use the following information to answer the question. Data and summary statistics about college professor's salaries was gathered from nine institutions and is presented below. This salary information is from professors teaching at the Master's level.
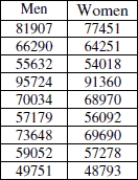

 Men: x = 67691; s = 14506 Women: x = 65323; s = 13274
-Which group has more variability? How would this affect the histogram for the group, compared to the other group? Explain.
Correct Answer:
Verified
View Answer
Unlock this answer now
Get Access to more Verified Answers free of charge
Q42: Use the following information to answer the
Q43: Explain in your own words what the
Q44: Use the following data to answer the
Q45: Use the following information to answer the
Q46: Use the following information for the question.
Q48: Use the following information to answer the
Q49: Use the following information to answer the
Q50: Use the following information to answer the
Q51: In your own words, explain what the
Q52: Use the following information to answer the
Unlock this Answer For Free Now!
View this answer and more for free by performing one of the following actions

Scan the QR code to install the App and get 2 free unlocks

Unlock quizzes for free by uploading documents