Use the following data to answer the question. Here are the scores on a recent statistics midterm exam (Scores have been listed from lowest to highest). A histogram showing the distribution is also included.
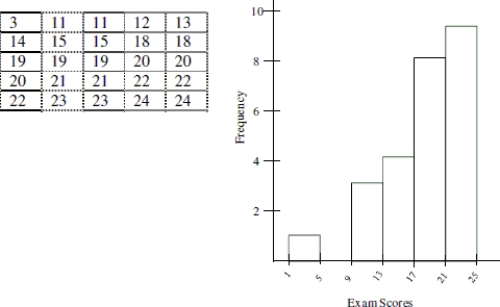
-Choose the most appropriate measure of variability for the data and calculate it. Explain why you chose the measure of variability that you did. Round all calculations to the nearest tenth if necessary.
Correct Answer:
Verified
View Answer
Unlock this answer now
Get Access to more Verified Answers free of charge
Q39: Based on the boxplot for the West,
Q40: Pick the statement that best describes the
Q41: Use the following information to answer the
Q42: Use the following information to answer the
Q43: Explain in your own words what the
Q45: Use the following information to answer the
Q46: Use the following information for the question.
Q47: Use the following information to answer the
Q48: Use the following information to answer the
Q49: Use the following information to answer the
Unlock this Answer For Free Now!
View this answer and more for free by performing one of the following actions

Scan the QR code to install the App and get 2 free unlocks

Unlock quizzes for free by uploading documents