The graph below displays the number of applications for a concealed weapons permit in Montcalm County, Michigan, for each of three years. A reported interprets this graph to mean that applications in 2010 are more than twice the level in 2008. Is the reported making a correct interpretation? 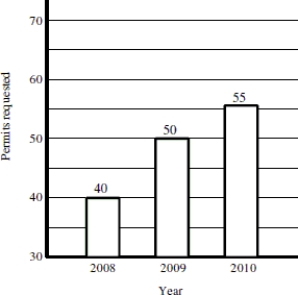
A) Yes. The bar for 2010 is twice the height of the bar for 2008 and the number of applications indicated above the bars shows that applications in 2010 are more than twice the level in 2008.
B) No. Although the 2010 bar is more than twice the height of the 2008, the bars do not begin at 0 applications, so the graph does not correctly represent the data. Fifty- five is not equal to two times the number of applications made in 2008.
C) No. The width of the bars is identical, indicating that the number of applications in 2010 is no different from 2008.
Correct Answer:
Verified
Q33: Which of the following statements about bar
Q34: Which of the following statements best describes
Q35: The histogram below shows the distribution of
Q36: The distribution of the numbers of times
Q37: In which category was there more variability
Q39: The graph below displays the number of
Q40: Find the original data set from the
Q41: Write a sentence to compare color preferences
Q42: According to the histogram, about how many
Q43: According to the histogram, about how many
Unlock this Answer For Free Now!
View this answer and more for free by performing one of the following actions

Scan the QR code to install the App and get 2 free unlocks

Unlock quizzes for free by uploading documents