The histogram below shows the distribution of pass rates on a swimming test of all children who completed a four week summer swim course at the local YMCA. How many of the courses had a pass rate less than 40 percent? 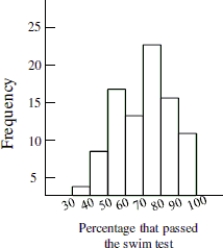
A) Not enough information available
B) About 5
C) About 3
D) About 8
Correct Answer:
Verified
Q30: Data was collected on hand grip strength
Q31: The histogram below shows the distribution of
Q32: The histogram shows the distribution of pitch
Q33: Which of the following statements about bar
Q34: Which of the following statements best describes
Q36: The distribution of the numbers of times
Q37: In which category was there more variability
Q38: The graph below displays the number of
Q39: The graph below displays the number of
Q40: Find the original data set from the
Unlock this Answer For Free Now!
View this answer and more for free by performing one of the following actions

Scan the QR code to install the App and get 2 free unlocks

Unlock quizzes for free by uploading documents