Data was collected on hand grip strength of adults. The histogram below summarizes the data. Which statement is true about the distribution of the data shown in the graph? 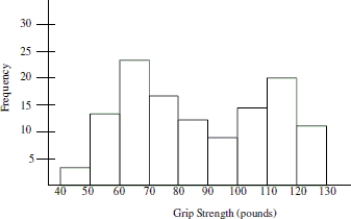
A) The graph shows evidence that two different groups may have been combined into one collection.
B) The graph is useless because it is bimodal.
C) There must have been a mistake made in data collection because the distribution should be bell- shaped.
D) The best estimate of typical grip strength is 80- 90 pounds because it is in the center of the distribution.
Correct Answer:
Verified
Q25: The histogram below is the distribution of
Q26: What is the mode response for 2001?
A)No
Q27: Based on the histogram below, would it
Q28: The distribution of test scores for a
Q29: The distribution of heights of adult females
Q31: The histogram below shows the distribution of
Q32: The histogram shows the distribution of pitch
Q33: Which of the following statements about bar
Q34: Which of the following statements best describes
Q35: The histogram below shows the distribution of
Unlock this Answer For Free Now!
View this answer and more for free by performing one of the following actions

Scan the QR code to install the App and get 2 free unlocks

Unlock quizzes for free by uploading documents