The data in the histogram summarizes the pitch speed of a sample of 75 pitches for a college pitcher during one season. Which of the following statements best describes the distribution of the histogram below? 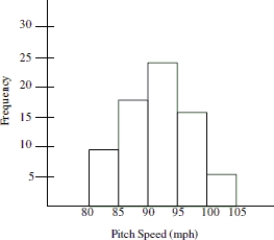
A) The distribution is right- skewed and shows that most of the pitches were more than 90 mph.
B) The distribution has a large amount of variation which can be seen by comparing the heights of the bars in the histogram.
C) The distribution is left- skewed and shows that most of the pitches were less than 95 mph.
D) The distribution is symmetric around a pitch speed of about 93 mph.
Correct Answer:
Verified
Q18: A collection of twenty college students was
Q19: The following graphic was used to visually
Q20: What percentage of the participants had a
Q21: Which of the following statements about bar
Q22: The histogram below displays the distribution of
Q24: The distribution of the numbers of times
Q25: The histogram below is the distribution of
Q26: What is the mode response for 2001?
A)No
Q27: Based on the histogram below, would it
Q28: The distribution of test scores for a
Unlock this Answer For Free Now!
View this answer and more for free by performing one of the following actions

Scan the QR code to install the App and get 2 free unlocks

Unlock quizzes for free by uploading documents