The histogram below displays the distribution of the length of time on hold, for a collection of customers, calling a repair call center. Use the histogram to select the true statement. 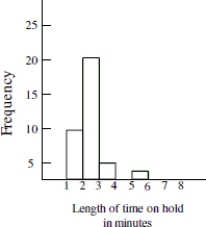
A) The distribution shows that the data was highly variable with some callers waiting on hold as many as 20 minutes.
B) The distribution is symmetrical. The number of callers who waited on hold for less than three minutes was the same as the number of callers who waited on hold for more than three minutes.
C) The distribution is left- skewed and most callers waited on hold at least three minutes.
D) The distribution is right- skewed and most callers waited on hold less than three minutes.
Correct Answer:
Verified
Q17: How many participants had a heart rate
Q18: A collection of twenty college students was
Q19: The following graphic was used to visually
Q20: What percentage of the participants had a
Q21: Which of the following statements about bar
Q23: The data in the histogram summarizes the
Q24: The distribution of the numbers of times
Q25: The histogram below is the distribution of
Q26: What is the mode response for 2001?
A)No
Q27: Based on the histogram below, would it
Unlock this Answer For Free Now!
View this answer and more for free by performing one of the following actions

Scan the QR code to install the App and get 2 free unlocks

Unlock quizzes for free by uploading documents